7:58 pm

November 4, 2017

Hi,
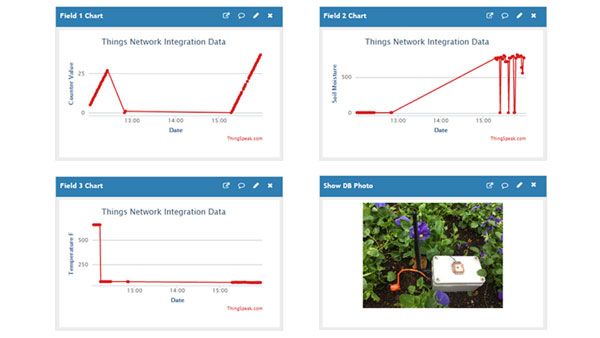
I have the Thingspeak plot below working but I want to fix the scale of the y-axis as 0 to 6.
I believe Ylim does not work with "thingspeakplot" and see from previous posts the suggestion to use "plot" instead but just cannot seem to get it to work.
Any help would be appreciated.
Thanks
Kim
=======================================
[Fence1Data, time] = thingSpeakRead(readChannelID, 'Fields', Fence1FieldID, 'NumPoints', 30, 'ReadKey', readAPIKey);
Fence2Data = thingSpeakRead(readChannelID, 'Fields', Fence2FieldID, 'NumPoints', 30, 'ReadKey', readAPIKey);
thingSpeakPlot(time, [Fence1Data, Fence2Data],'legend',{'Fence1', 'Fence2'});
=============================================
8:55 am


Moderators
March 7, 2017

You can set the axis to custom values using the pencil icon on your thingSpeak plots.
If you want to do it in the code, use plot() instead of thingSpeakPlot(). You will be able to use ylim() as you suggested. For the case you describe above, use ylim([0 6]).
For the plotting, I suggest
plot(time, data1,time,data2);
and then see the documentation for legend to add a legend.
Let us know if that works.
Most Users Ever Online: 114
Currently Online: Hans, agrisensezm
36 Guest(s)
Currently Browsing this Page:
1 Guest(s)
Top Posters:
rw950431: 261
Vinod: 196
piajola: 85
turgo: 70
vespapierre: 63
Adarsh_Murthy: 62
Member Stats:
Guest Posters: 1
Members: 5703
Moderators: 0
Admins: 2
Forum Stats:
Groups: 4
Forums: 17
Topics: 1313
Posts: 4565
Newest Members:
Archieter, JamesExedo, IrbosHich, brodi, kasko, franklin castroAdministrators: Hans: 387, lee: 457