2:15 am

March 6, 2013

Hi,
I have gone through the link : http://community.thingspeak.com/documentation/
My intention is to install Thingspeak on my local Ubuntu 12.04 PC and to send test data to private server(local Ubuntu 12.04 PC). And i want to display the test data on chart.
In order to acheive this, i have gone through the link : https://github.com/other/thingspeak and i am able to install Thingspeak on my local Ubuntu 12.04 PC.
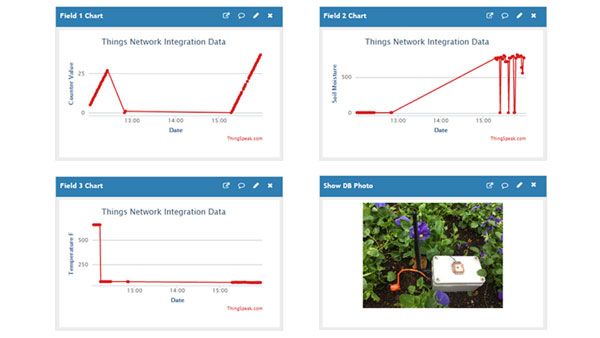
I am able to upload data to the channel through the firefox poster add-on ,after uploading i can retrieve the data with no error on json, xml, csv format. but when i click on "view chart"option it shows a empty chart(a blank chart with x and y axis) and when i update the chart with new names(x axis, y axis and title) its not getting updated.
second problem is there is no "apps" option in menu..
Please guide me on this issue to know how to display the data on chart.
Thanks,
Deepak
Most Users Ever Online: 166
Currently Online:
20 Guest(s)
Currently Browsing this Page:
1 Guest(s)
Top Posters:
rw950431: 272
Vinod: 240
piajola: 95
turgo: 70
vespapierre: 63
Adarsh_Murthy: 62
Member Stats:
Guest Posters: 1
Members: 8665
Moderators: 1
Admins: 2
Forum Stats:
Groups: 3
Forums: 14
Topics: 1600
Posts: 5760
Newest Members:
Advantagetreeexperts, laundrydaddyuk, techhhelp5, ken, tran, huldacormierModerators: cstapels: 460
Administrators: Hans: 405, lee: 457