5:06 am

August 19, 2018

I connected a sensor to capture (volt and current across a component) to a raspberry pi, and I wanna plot an IV curve.
in my code, I'm running a sweep to capture those data, my code works just fine and I can plot the IV curve on my GUI by using matplotlib.
In addition to my project, I wanna display/plot the IV curve online. Then I thought of using Thingspeak for this matter, but I noticed that it can only plots one data against time/date.
Is there anyway that I can plot two data on one graph and neglect the time?
Note that the data I'm sending to my Thingspeak channel are two variables i and v which each one has 14 values.
screenshots:
- data exported from Thingspeak
- commands used in python
8:36 am


Moderators
March 7, 2017

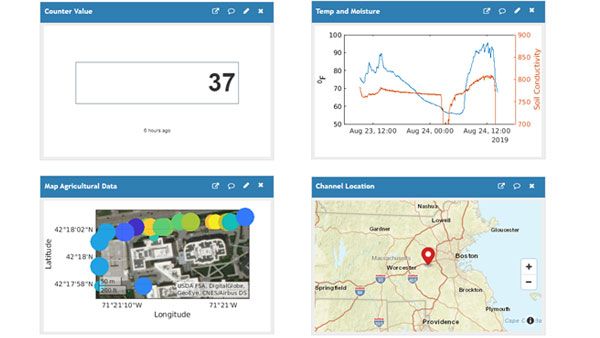
Here is a two axis plot example without time on the independant axis: https://www.mathworks.com/help/thingspeak/Visualize-Correlation-Between-Temperature-and-Humidity.html
You can also use the MATLAB plot() or scatter() functions, they have different options.
Your data format is not in the standard arrangement - do you intend each entry to be a new IV sweep?
You can read the data
dataTable=thingSpeakRead(CHID,'outputformat','timeTable','readkey','xxxxxxxxxxxxxxxx'...)
then use str2num and char to get the values.
vectorX=str2num(char(dataTable.Field1Label));
Repeat for both field 1 and 2.
Then you can plot() or thingSpeakScatter(vectorX,vectorY, etc.)
Let us know if that works.
Most Users Ever Online: 166
Currently Online:
31 Guest(s)
Currently Browsing this Page:
1 Guest(s)
Top Posters:
rw950431: 272
Vinod: 240
piajola: 95
turgo: 70
vespapierre: 63
Adarsh_Murthy: 62
Member Stats:
Guest Posters: 1
Members: 8665
Moderators: 1
Admins: 2
Forum Stats:
Groups: 3
Forums: 14
Topics: 1600
Posts: 5760
Newest Members:
bogart, estebanmateo93, mikewrite, onlinebusiness, winzy99, Zark_zeuganModerators: cstapels: 460
Administrators: Hans: 405, lee: 457