10:50 am


Silver
March 13, 2019

a third question, if I may ...
I'm using an area to display the difference between two lines.
diff = line1(1:maxCount) - line2(1:maxCount);
a = area(line1.Timestamps(1:maxCount), diff(1:maxCount));
How could I change the color depending on the resulting value? E.g. everything in 'green' except if values '<5' which should be displayed in 'red'.
The area starts below zero:
set (a, 'BaseValue', min-2.5)
Thanks for your help
1:02 pm


Moderators
March 7, 2017

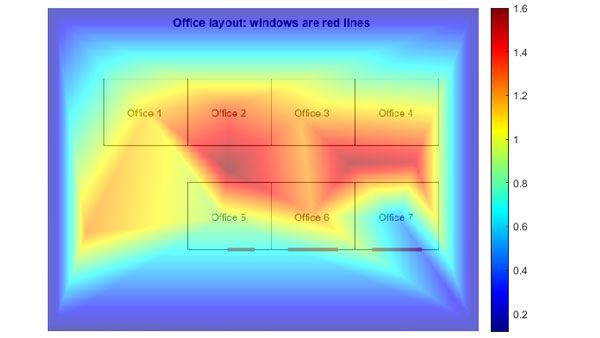
This example shows conditional formatting:
https://www.mathworks.com/help/thingspeak/Plot-Temperature-and-Wind-Speed-on-Two-Different-Axes.html
1:41 am


Silver
March 13, 2019

hmm, maybe my question was not as precise as it should have been...
I'm looking for a way to paint an area in two different cvolors depending on its value, e.g. as in this example from my Raspberry Pi where the area is either 'green' or 'red'. The color depends on the result of the maths from 'line1 - line2'.
How could I do that in MATLAB?
Most Users Ever Online: 166
Currently Online:
24 Guest(s)
Currently Browsing this Page:
1 Guest(s)
Top Posters:
rw950431: 272
Vinod: 240
piajola: 95
turgo: 70
vespapierre: 63
Adarsh_Murthy: 62
Member Stats:
Guest Posters: 1
Members: 8665
Moderators: 1
Admins: 2
Forum Stats:
Groups: 3
Forums: 14
Topics: 1600
Posts: 5760
Newest Members:
Advantagetreeexperts, laundrydaddyuk, techhhelp5, ken, tran, huldacormierModerators: cstapels: 460
Administrators: Hans: 405, lee: 457