8:19 pm

January 15, 2019

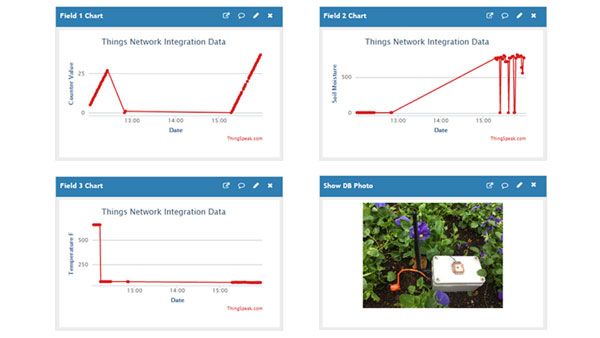
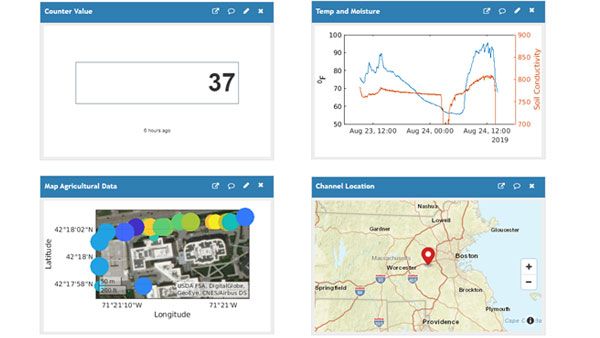
I'm trying to set good limits for the Y-axis on my publicly viewable channels, but the limits are ignored, and worse still aren't even logical. For example on this channel: https://thingspeak.com/channels/570759 the field 1 plot goes from 2500 to 4500, which is close to what I want (2600 to 4300 would be preferred), but in order to get that range and granularity I needed to change the Y-axis limits to 2900 min to 4010 max, totally unrelated to the real Y-axis limits. If I set the Y-axis limits to 2500 to 4500, the plot goes from 2000 to 5000. Pretty maddening. Is there any logic to how this works and why can't we just set the limits exactly as instructed?
2:20 pm


Moderators
March 7, 2017

Using the charts API, I can get what you need I think:
https://thingspeak.com/channels/570759/charts/1?bgcolor=%23ffffff&color=%23d62020&days=1&dynamic=true&results=800&type=line&yaxismax=4300&yaxismin=2600&height=1000&width=1000
Does that work for you?
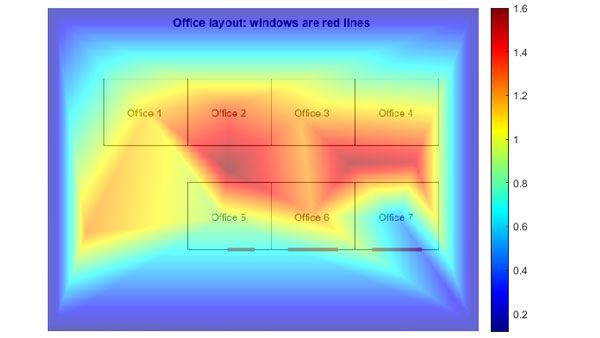
The charts used in the channel view have some defaults that set the limits automatically in some cases, possibly based on tick values, etc. You can overcome this by creating a separate MATLAB visualization to plot the data using the MATLAB plot() command, or any one of the other plotting functions.
https://www.mathworks.com/products/matlab/plot-gallery.html
I will submit your feedback to the tracking system here for possible change in a future release. We appreciate your feedback on what you like and don't like about the site.
6:49 pm

January 15, 2019

cstapels said
Using the charts API, I can get what you need I think:
https://thingspeak.com/channels/570759/charts/1?bgcolor=%23ffffff&color=%23d62020&days=1&dynamic=true&results=800&type=line&yaxismax=4300&yaxismin=2600&height=1000&width=1000
Does that work for you?The charts used in the channel view have some defaults that set the limits automatically in some cases, possibly based on tick values, etc. You can overcome this by creating a separate MATLAB visualization to plot the data using the MATLAB plot() command, or any one of the other plotting functions.
https://www.mathworks.com/products/matlab/plot-gallery.htmlI will submit your feedback to the tracking system here for possible change in a future release. We appreciate your feedback on what you like and don't like about the site.
Thanks, very helpful, didn't know about the charts API before, and it looks like it has a lot more control. Appreciate you submitting feedback on the channel view also.
6:38 am


Moderators
March 7, 2017

5:35 pm

January 15, 2019

Actually, I just did some more testing, and it still isn't taking the limits literally, it still does a bit of auto-scaling. With 4300 max Y limit, it actually uses 4400. Much closer than the charts on the thingspeak channel view, but still not perfect. I can't use Matlab plots because I want it to auto-update.
Most Users Ever Online: 166
Currently Online:
31 Guest(s)
Currently Browsing this Page:
1 Guest(s)
Top Posters:
rw950431: 272
Vinod: 240
piajola: 95
turgo: 70
vespapierre: 63
Adarsh_Murthy: 62
Member Stats:
Guest Posters: 1
Members: 8665
Moderators: 1
Admins: 2
Forum Stats:
Groups: 3
Forums: 14
Topics: 1600
Posts: 5760
Newest Members:
huldacormier, bogart, estebanmateo93, mikewrite, onlinebusiness, winzy99Moderators: cstapels: 460
Administrators: Hans: 405, lee: 457