12:39 pm

January 13, 2020

3:07 pm


Moderators
March 7, 2017

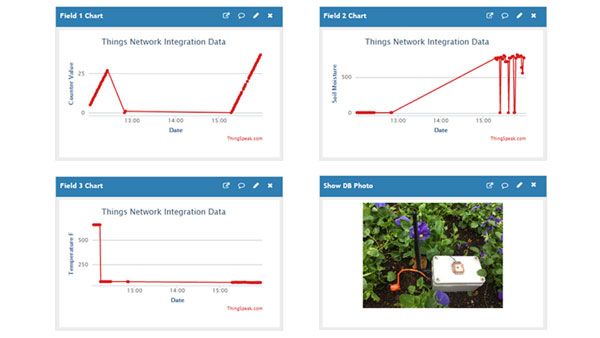
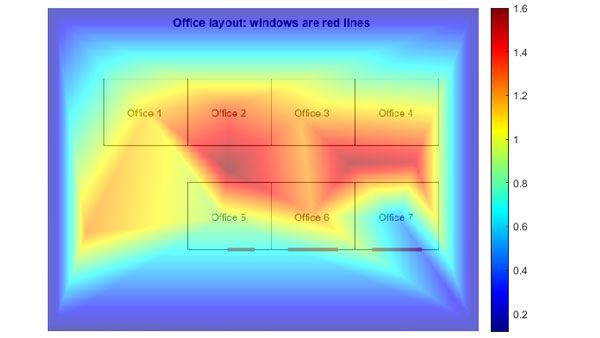
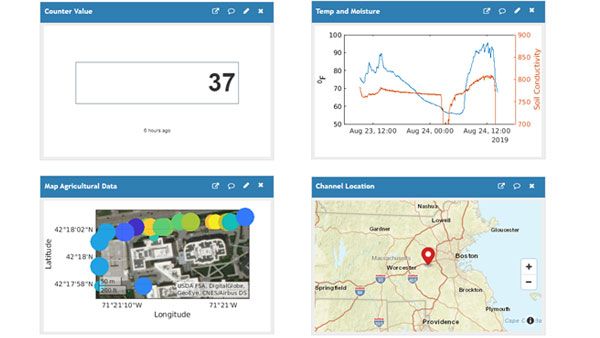
I recommend using a MATLAB visualization instead of the plug in. Use plot and then hold and then plot again to keep adding more plots. You could also use subplot if you want to stack plots in other ways.
Are you reading all eight fields with one call, or are you using separate calls for each of the lines on your plot?
FYI, MATLAB answers is the preferred location for ThingSpeak Community support.
6:28 am

August 20, 2020

cstapels said
I recommend using a MATLAB visualization instead of the plug in. Use plot and then hold and then plot again to keep adding more plots. You could also use subplot if you want to stack plots in other ways.
Are you reading all eight fields with one call, or are you using separate calls for each of the lines on your plot?
FYI, MATLAB answers is the preferred location for ThingSpeak Community support.
Thank you for your help
Most Users Ever Online: 166
Currently Online:
31 Guest(s)
Currently Browsing this Page:
1 Guest(s)
Top Posters:
rw950431: 272
Vinod: 240
piajola: 95
turgo: 70
vespapierre: 63
Adarsh_Murthy: 62
Member Stats:
Guest Posters: 1
Members: 8665
Moderators: 1
Admins: 2
Forum Stats:
Groups: 3
Forums: 14
Topics: 1600
Posts: 5760
Newest Members:
huldacormier, bogart, estebanmateo93, mikewrite, onlinebusiness, winzy99Moderators: cstapels: 460
Administrators: Hans: 405, lee: 457